Catalog Number|Packaging
Mat. No |
Ref. No |
No. of preps |
-
Description
Metagenomics is a strategy to study the through genomic information of all tiny biological genetic material in the environment. It avoid culturing the microbe in the samples, provide a method to study microbes that can’t be cultured, more truly react the component and interaction of microbes in the samples, and we can study it’s metabolic pathway and gene function in molecule level. and is widely used in the field of microbiology.
-
Technical Workflow
Scheme design → Sample processing → Library construction & sequencing → Data analysis → After-sales service
-
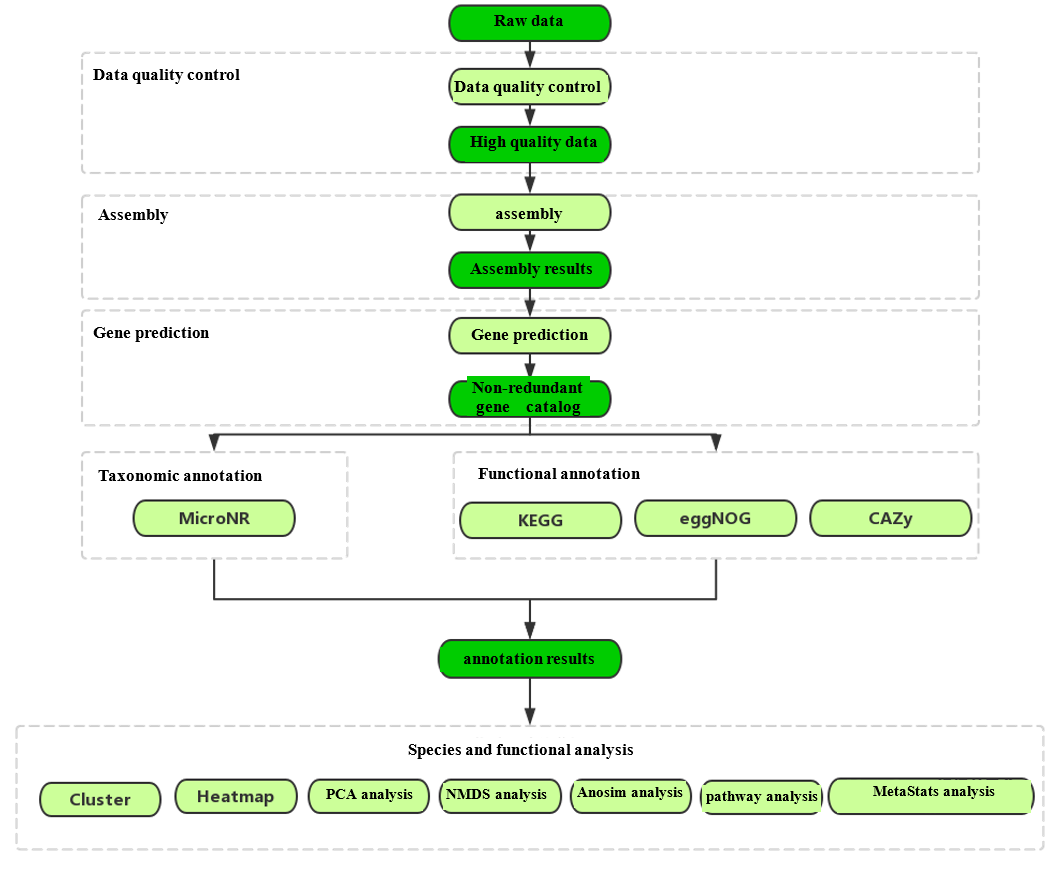
Analysis Workflow
-
Features
1. Mature schemes are prepared for extracting all kinds of environmental samples;
2. With comprehensive sample information, the bacteria, fungi and virus can be detected at one time;
3. A variety of personalized advanced analysis could explain biological problems more comprehensively;
-
Parameter

-
Applications
Industrial field, human microbiology, environmental microbiology, agricultural field
-
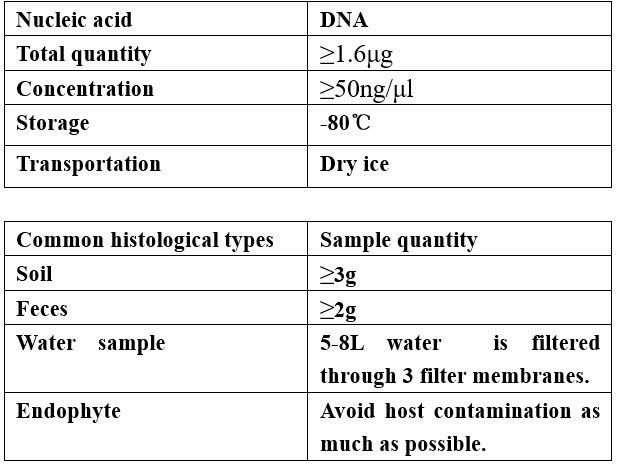
Requirements of Samples
-
Results Demo
Cluster heat map of gene abundance

Data from the relative abundance table of different classification levels. Select the abundance information in genus level to draw the heat map, and carry out clustering in species level to facilitate the result display and information discovery, thus finding out which species are highly cluster in the sample.
Anosim analysis in gate level
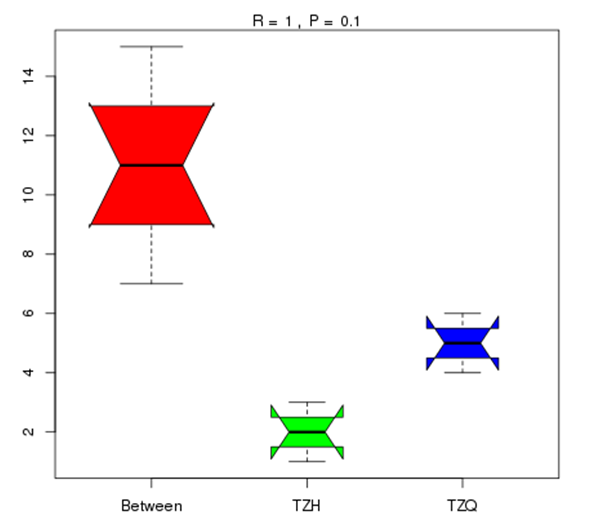
As a nonparametric test, Anosim analysis is used to test whether the differences between groups are significantly greater than that within groups, thus judging whether grouping is meaningful.
Cladogram of LEfSe analysis

In order to screen biomarkers with significant differences among groups, firstly, the rank sum test is used to detect the different species among different groups, and LDA (Linear Discriminant Analysis) is used to reduce dimension and get LDA score.LEfSe results include three parts: the histogram of LDA scores, the cladogram and abundance heatmap of biomarkers with statistical differences among groups.
-
Sort by
-
Date
Date(
)
Date
Date(
)
Impact Factor
IF(
)
Impact Factor
IF(
)


 Inquire